| Identification | GRAPH |
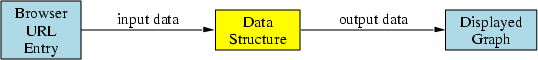
| Purpose | This is the primary object which holds all graph information. All
individual connected components (each with a single root) are stored
here as a single graph. Data in this object would be passed to the
Graphviz utility for the generation of the actual graph display. |
| Function | This object enables events 1, 2, and 3 as defined in this section:
Preference Change, Browser Input, and Display Interaction.
This object realizes the following functional requirements:
- 3.4.3: Multiple roots
- 3.4.4: Automatically getting new roots
- 3.4.5: Manually creating new roots
- 4.2.6: Changing the Root
- 4.3: Preferences
- 3.5.1: Growth direction
- 3.5.2: New nodes
- 3.5.3: Stability
- 3.6: Pruning
- 3.7.1: Partial Equivalence Clustering
- 3.7.2: Grouping clustering
- 3.7.3: Reduction clustering
- 4.2.3: Inspecting nodes
- 4.2.4: Adding New Edges and Nodes
- 4.2.5: Inspecting the graph
- 4.3: Preferences
|
| Methods | Retrieval and assignment to a specific node or edge within the graph
is accomplished using appropriate methods from the LinkedList and
internal methods from the Node or Edge objectes. |
| updatePreferences()
This method is used to tell the data structure that new preferences
have been defined, and that the data needs to be updated with the
new settings. |
| updateURL()
When a new URL is entered from the browser, this method is used to
update the current URL to the one entered. The data structure will
then generate a new graph and pass it to the display. |
| removeNode()
Nodes in the connected component are deleted entirely using this method.
All edges leaving this deleted node, and all nodes and edges derived
thereafter are also deleted. This method is meant to support manual
as well as automatic deletion of nodes (pruning) in accordance with
the Preference design. |
| addNode()
A node and corresponding edge will be added to connected component.
This would usually be done automatically, as the user were to browse
websites and add to the browse history. The growth of the graph happens
with the use of this method. |
| Data | Internal data of this object is a vector of CNCTDCOMPONENT
instances.
- LinkedList <CnctdComponent>
|
|