| Input | Sites visited through the Mozilla browser. |
| Processing | Build up an internal data structure Decorate nodes (See section ) Decorate edges (See Section ) Render the graph using GraphViz tools. |
| Output | Displayed graph representing browser history. |
| Input | User input concerning preferences for the labels of the nodes. |
| Processing | Labels for the nodes can be a number, added in an incrementing order corresponding to the time-line in which the user visits each page, the domain name of the node, to conserve space, or the entire URL of the web-page. In either case, the space allotted for the node label will be limited and upon selecting the node, the complete label will be displayed. |
| Output | Proper node labels are displayed. |

| Input | User input concerning preferences for the style of the nodes. |
| Processing | Graph is rendered using user specified style parameters. |
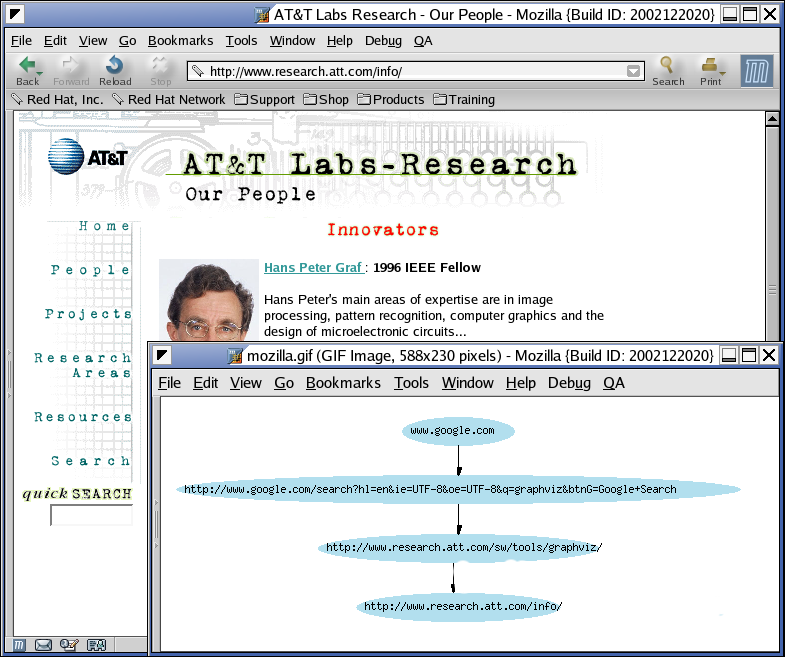
| Output | Proper node labels are displayed. See the figure below for a complete URL labels example. |
| Input | History graph. User preference settings for derived style application. |
| Processing | URLs corresponding to nodes are traversed, and their relevant characteristics are derived. Individual node style is updated. |
| Output | Corresponding node styles' are updated accordingly. |

| Input | A site is visited and automatically contained in a node data structure. |
| Processing | If the current URL exists in a previous node, nothing is done; otherwise, a new node is created as the new root. |
| Output | New root or nothing |
| Input | History graph |
| Processing | Format the edges. |
| Output | Directed or undirected graph layout. |
|
| Input | History graph |
| Processing | Redundant edges implied by transitive hyperlinking relationship are removed. |
| Output | Reduced history graph. |
| Input | History graph. |
| Processing | URLs corresponding to nodes are traversed, and their relevant characteristics are derived. |
| Output | Correponding edge styles' are updated accordingly. |
| Input | Browser launched, and home page brought up. |
| Processing | If page does not exist in previous tree, tree data structure initialized with page as its root. Graph is drawn. |
| Output | Graph with a single root node representing the current page. |
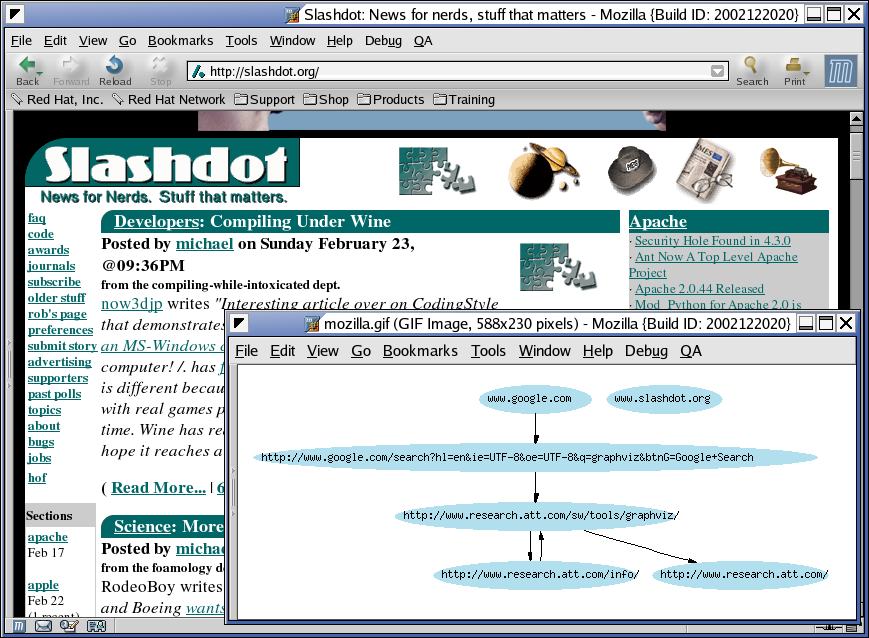
| Input | A new site is visited without using a link, such as direct URL entry or Bookmark selection. |
| Processing | If the new site does not exist elsewhere in any previously generated graph, then it becomes the root of a new graph. A new data structure is initialized with page as its root. |
| Output | A new graph is drawn beneath the older graph. |
| Input | Node is selected and CREATE NEW TREE button is clicked. |
| Processing | The node is removed from its previous tree, along with all nodes in branches extending from it. |
| Output | Old graph is redrawn and new graph is created and drawn. |
| Input | Browser history data in tree data structure. |
| Processing | Appropriate options will be chosen in the GraphViz tool to produce scrolling. |
| Output | Scrollable viewport. |
| Input | A new page is visited using a link on the current page. |
| Processing | A new node representing the new page is created and added to the tree data structure. The display of the old tree is redrawn to reflect the added node. |
| Output | New node is added to the graph. |
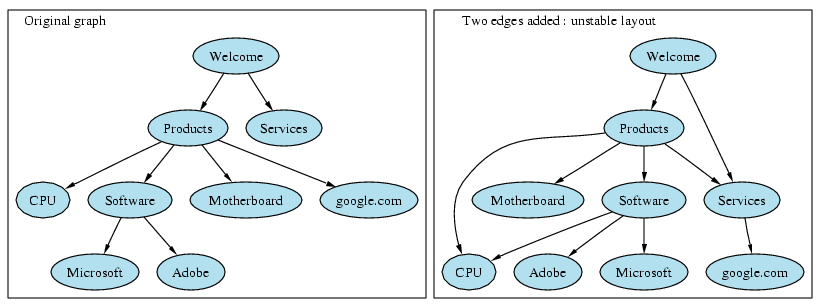
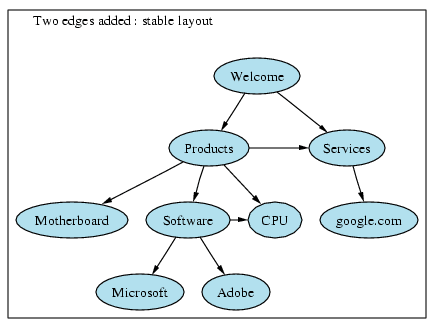
| Input | Continuous visits to new sites using links will make the tree grow. |
| Processing | Existing options chosen within the GraphViz graph-drawing tool will keep the tree stable and familiar as new nodes are added to it. If options do not already exist, algorithms will be implemented towards this purpose. |
| Output | Graph remains familiar as it grows without radical changes. |
| Input | The criteria for pruning as such as age or frequency. |
| Processing | The nodes that satisfy the pruning cutoff are removed. |
| Output | The graph is redrawn. . |
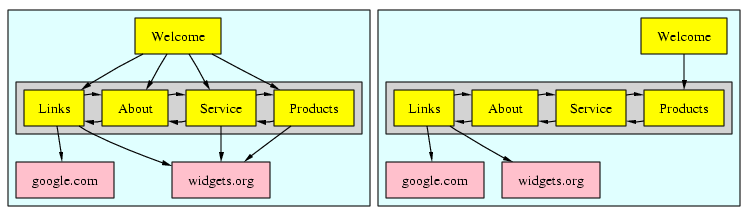
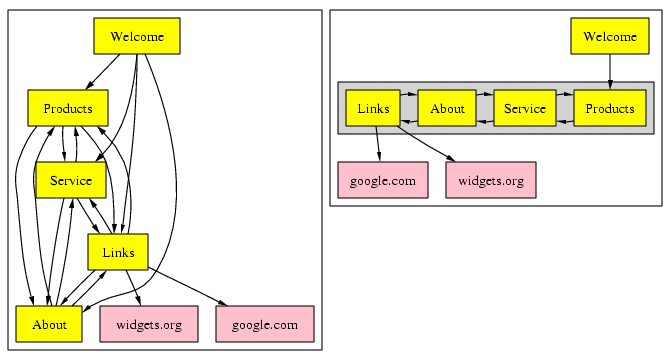
| Input | The graph. User's criteria for partial equivalence. |
| Processing | All partially equivalent node sets are grouped in a bound area in the layout. Redundant edges implied by transitivity are removed. |
| Output | The graph is redrawn with grouped node area is highlighted for easy reference. |
| Input | The graph. User's criteria for partial equivalence. |
| Processing | All partially equivalent node sets are collapsed into a single node. All edges leading into collapsed nodes are redirected into the new node. |
| Output | The graph is redrawn. |

| Input | The user will single left-click on the button to open the SpiderGraph window. The user double-clicks on a node in the graph. |
| Processing | The button activates the window. |
| Output | The window opens with the current SpiderGraph web page history. |
| Input | The user double-clicks on a node in the graph. |
| Processing | SpiderGraph tells Mozilla to open the corresponding web-page. The graph window is deactivated. |
| Output | Mozilla displays the corresponding web-page. Graph window closes. |
| Input | The user single-clicks on a node in the graph. |
| Output | The selected node is outlined. |
| Input | Single left-click and then right-click. |
| Processing | Information about the node and/or the graph is collected. |
| Output | The information is displayed on the screen. |
| Input | User click on a link on a web-page. |
| Processing | New node for the target URL is created, if it is not already exists. An edge from node with linking URL to the target is created. |
| Output | Graph is augmented with a new node and an edge, or an edge to an existing node. |
| Input | The cursor is floated above a node (no click). |
| Output | Data about the node is displayed in a small text box (like a help box). |
| Input | User right-clicks on a node, and selects Make root. |
| Processing | Selected node becomes a root. Nodes linking to the root are removed. Graph is reformatted. |
| Output | Graph is redrawn with a new root. |
| Input | User selects SpiderGraph Preferences from Mozilla Preferences menu. |
| Processing | Configuration information is collected. |
| Output | Preferences window is shown with parameters changeable by the user. |


|
|
|
|
|
|